SARAWAK PLANTATION BERHAD
|
13
|
Annual Report 2014
Message to Our Shareholders
Other Activities
Our other business segments offer valuable synergies
but currently contribute negligibly to the Group’s
revenue.
In Conclusion
The Board believes the Company’s financial
performance was satisfactory for the year in
review. As a commodity producer, our business
is cyclical in nature and we have to work within the
constraints imposed by global market factors
entirely beyond our control.
Dividends
On 27 August 2014, the Company declared a first
interim, single tier dividend of 6 sen per share,
totalling approximately RM16.8 million, in respect
of the financial year ended 31 December 2014
which was paid to shareholders on 8 October 2014.
On 24 February 2015, a second interim, single tier
dividend of 3 sen per share was declared, totalling
approximately RM8.4 million, and was paid to
shareholders on 9 April 2015.
This represents a total distribution to shareholders
of approximately RM25.2 million or 41% of the
Group's net profits for the year. The dividend yield
is 4% based on the year-end share price of
RM2.34 and in the Board's opinion offers investors
satisfactory short-term financial returns whilst
maintaining cash reserves for future growth.
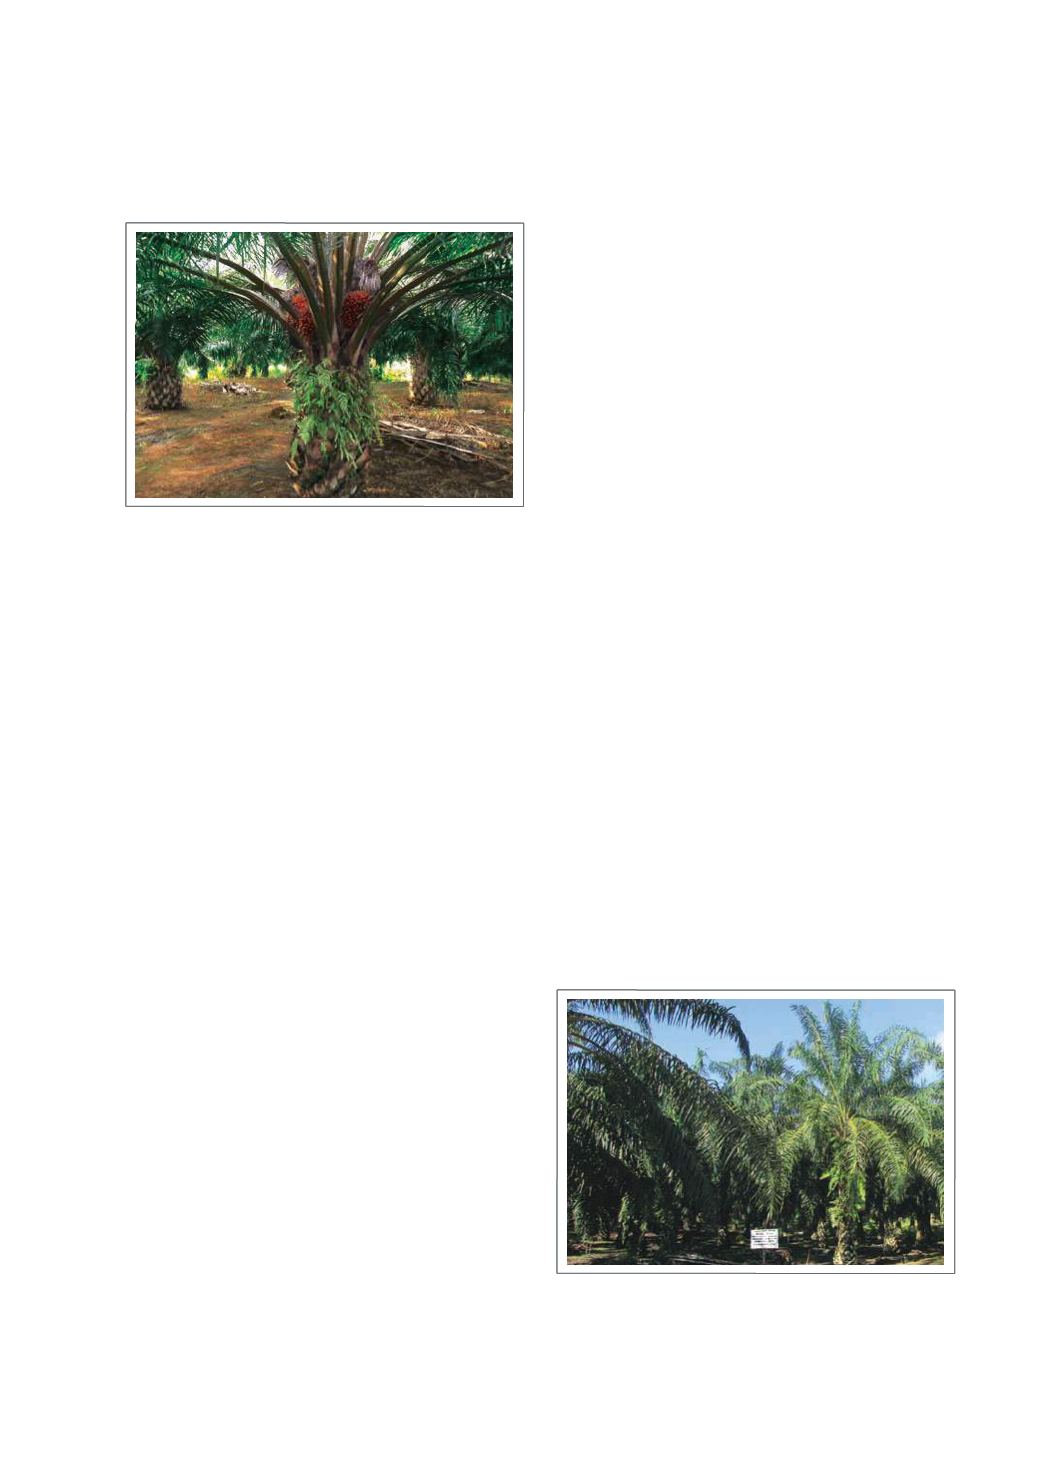
FFB Production and Yield
Production of fresh fruit bunches (FFB) from our
estates was 289,076 mt in 2014 compared to
309,218 mt in 2013, while yield was 11.60 mt
per ha in 2014 compared to 12.37 mt per ha in
2013. Lower volume was mainly due to 2014 being
a low cropping year coupled with replanting activities.
Oil extraction rate
Our oil extraction rate (OER) was 20.88% in 2014
against 20.87% in 2013 whereas kernel extraction
rate was 4.49% in 2014 compared to 4.48% in
2013, both recorded a marginal improvement.
Nevertheless, our OER was higher than Sarawak
average of 20.43%.
Increase in CPO and PK Production
Our mills recorded an increase of 3.6% in the
FFB processed from 655,401 mt in 2013 to
678,789 mt in 2014.
Output of CPO was 141,742 mt and PK was
30,493 mt, increases of 3.6% and 3.8% respectively
principally due to increase in purchases of FFB
from externel parties. This demonstrates the value
of our outsourcing policy and the effectiveness
of our quality control system for outsourced FFB.
Sales Volumes of CPO and PK
Sale volumes of CPO recorded an increase of 2%
whereas sale volume of PK decreased.


